The Cohort Experience
How the Cohort Pulse works.
Start to finish.
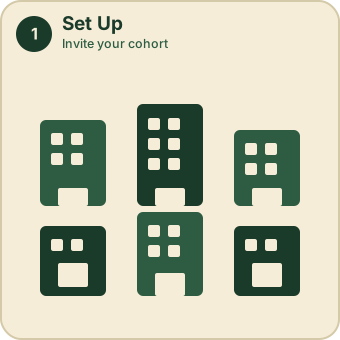
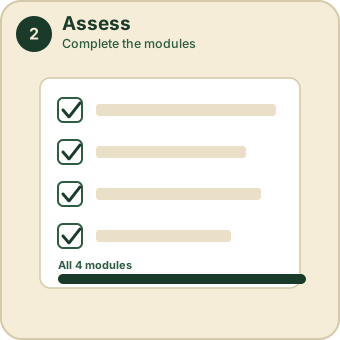
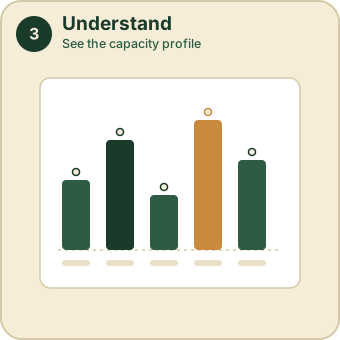
A funder, CSR program, or TA provider runs one cohort convening. Here's what each organization moves through, start to finish.
Mission statements tell you what an organization wants to do. BoardPulse tells you whether it can, and if not, what it'll take to get there — scoring governance, financial management, fund development, and impact measurement before the board loses key members, the grant report comes in three months late, or the organization can't produce the financials a lender needs when it's go time. Free for nonprofits tracking their own growth, designed for the funders and lenders who need to know what an organization can execute.
Lenders underwrite the loan — not the organization's ability to manage it.
Funders fund the program — not the readiness behind it.
Agencies report outcomes — without a capacity baseline.
A Yes/No diagnostic across all four modules — no consultant required.
Cumulative gate logic places the org on a 0–10 maturity scale, module by module.
An instant, plain-language capacity report translates the score into clear next steps.
BoardPulse was built by Aaron Laramore, drawing on two decades as a CDFI underwriter and community investment professional at leading national financial intermediaries — including the Corporation for Supportive Housing (CSH) and the Local Initiatives Support Corporation (LISC) — where he assessed organizational capacity as a component of credit risk and originated a $15M+ loan and grant portfolio. The scoring logic behind each module reflects the same questions an underwriter asks before capital is invested. BoardPulse makes that analysis instant, consistent, and repeatable across an entire portfolio of organizations.
This isn't a survey or a checklist. It's a seasoned underwriter's capacity analysis, captured in an algorithm.
BoardPulse is developed by Consept, a social investment thinktank connecting capital to community capacity.
Board structure, oversight, and succession planning.
Internal controls, reserves, and reporting discipline.
Revenue diversification and pipeline health.
Data practice and outcomes tracking.
Webinars, funder briefings, and conferences where BoardPulse is on the agenda, and live cohorts where BoardPulse is being deployed.
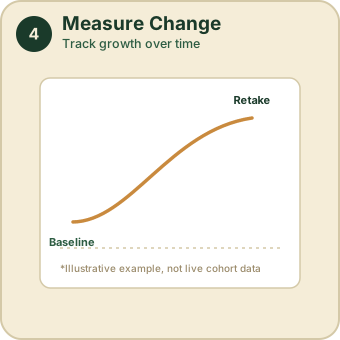
An illustration based on an actual BoardPulse deployment — a volunteer board-led housing nonprofit — showing where the organization stands now, and what three years of capacity investment could look like.
A funder, CSR program, or TA provider runs one cohort convening. Here's what each organization moves through, start to finish.
The full diagnostic, a plain-language report, and every reassessment over time — at no cost, permanently. No trial period, no paywall on tracking your own progress. You'll also join as a founding member of the BoardPulse Data Cooperative, with a real ownership stake in what this data becomes.
Take My PulseA no-cost snapshot of capacity across a slice of your own portfolio. Select a sample of 10 organizations you already work with to complete the BoardPulse diagnostic through a dedicated sponsor link. Consept aggregates the de-identified results into a Capacity Brief: a field-level read on organizational capacity for your selected group.
A fully managed capacity-building cohort for the organizations in your portfolio. Consept sets up your Program and roster, opens a baseline assessment window where each organization works through all four modules on its own schedule, and manages the process end to end — completion tracking, participant support, and direct follow-up when an organization stalls. You get a funder-ready Cohort Roll-Up Report identifying shared strengths and capacity gaps across the cohort, plus a scheduled follow-up round and formal comparison showing what changed. For cohorts up to 25 organizations.
Aggregated portfolio data, capacity-ROI reporting, and grantee roll-ups for the institutions investing in these organizations — currently in development. Reach out to talk through what this could look like for your organization.
Every assessment your organization completes does more than track its own progress — it adds to a shared asset. BoardPulse is structuring itself as a Data Cooperative, so the nonprofits generating this dataset hold a real, appreciating stake in what it's worth. As the network grows, so does your organization's ownership share — allocated transparently, governed by one member, one vote, and reflected as a real asset on the org's books, not a line in a rewards program.
Every assessment — and every year your organization tracks its progress — builds the organization's ownership stake.
A share of institutional revenue flows back to member organizations as patronage equity, published on a transparent, annual cycle.
Founding members help write the bylaws. One member, one vote — regardless of size or stake.
A cooperative-owned dataset changes the incentive on the nonprofit side of the ledger. Organizations with real equity in the outcome have reason to engage consistently and report honestly — not just satisfy a funder's requirement. That produces a longitudinal signal no purely transactional tool can match, and it keeps the sector's own capacity data a shared asset the field holds together, not one vendor's proprietary product.
Learn More